
Meat & T2D again – Zoë Harcombe

Executive summary
* A paper published in the Lancet broke the record for the number of emails in my inbox asking me to review a study. This was because the claim that meat is associated with type 2 diabetes (T2D) makes no sense to any sensible person.
* The Lancet paper pooled 31 population studies from 20 countries to make its claims.
* Some numbers in the paper literally didn’t add up. I’ve queried them with the corresponding author. The paper claimed that having pooled data from almost two million people, who were studied for approximately 10 years, there was an association between consuming a high intake of unprocessed meat, processed meat and (not so much) poultry and developing T2D.
* There were many issues with the paper:
Issue 1 – the inaccuracy of Food Frequency Questionnaires/dietary history (upon which all 31 studies relied.)
Issue 2 – the definitions of meat. One of the studies (which I examined in detail) included sandwiches and lasagna as ‘meat’. Others likely had carbohydrate confounders.
Issue 3 – population studies can only claim association not causation. The risks claimed in this paper were way off anything that could suggest causation.
Issue 4 – relative vs absolute risk. The incident rate in the study was barely half a percent in any one year. An 8%, 10% or 15% risk difference applied to this is tiny on top of very small.
Issue 5 – the healthy person confounder. ‘Burger monsters’ have a completely different profile to people who consume very little meat. This can never be fully adjusted for in any study and so this paper has merely pooled 31 confounded studies.
Issue 6 – the studies are too different to be pooled together. This was confirmed by statistical numbers in the paper; I explain how.
Issue 7 – actual meat consumption was barely half the intake used to estimate risk. I likened what the researchers had done here to – if, across 31 studies, people averaged fewer than 50 cigarettes a week, the researchers decided they were going to estimate the risk of smoking 100 cigarettes a week.
Issue 8 – the researchers failed to propose a plausible mechanism for the absurdity that something that contains no glucose (meat) can somehow be associated with a glucose-handling condition (T2D).
The plausible mechanism is that meat is eaten with carbs – e.g. a ham sandwich or a burger, bun & fries – and this paper is condemning the meat for what the carbs did.
Introduction
I don’t think I have ever received so many emails, so quickly, about one article. We woke on Wednesday 21st August to the news that “Eating just two slices of ham per day could raise diabetes risk” alongside a picture of a ham sandwich (Ref 1). I tweeted “blaming the ham for what the bread did (rolling eyes icon).”
The day’s headlines were mostly UK based and they emanated from a press release from Cambridge university with the title, “Red and processed meat consumption associated with higher type 2 diabetes risk” (Ref 2). Under the title was a picture of a ‘full English breakfast’ – bacon, egg, sausage, baked beans and fried bread. Blaming the bacon and egg for what the bread and beans did (where’s that icon again?)
The press release was about a paper published in the Lancet called “Meat consumption and incident type 2 diabetes: an individual-participant federated meta-analysis of 1·97 million adults with 100 000 incident cases from 31 cohorts in 20 countries” (Ref 3).
The reason I received so many emails is because the idea that meat can, let alone does, have anything to do with type 2 diabetes (T2D) makes no sense. Diabetes is essentially the inability to handle glucose. People with T2D are unable to keep blood glucose levels within normal ranges due to impaired insulin functioning. Meat contains no glucose (other than the glycogen in liver) and so the notion that meat can possibly be associated with diabetes is absurd to sensible people (Ref 4). Carbohydrates contain glucose. An association with carbohydrate makes sense, of course.
The senior authors of the Lancet paper were jointly Professors Nita Forouhi and Nicholas Wareham – both from the Medical Research Council Epidemiology Unit, at Cambridge University. The lead author was Li, so I’ll refer to this paper as Li et al. There were several authors, as the paper was a multi-nation collaboration.
The study
Typically, researchers who want to find an association between meat and T2D (yes, that’s what they set out to do) use one or two population studies for data. October 2023 was the last time there was a major paper implying ‘eat meat, get diabetes.’ That paper was by Gu et al and it was called “Red meat intake and risk of type 2 diabetes in a prospective cohort study of United States females and male” (Ref 5). I did a Monday note on it at the time (Ref 6). That paper used data about women from the US Nurses’ Health Study I (NHS I) and the US Nurses’ Health Study II (NHS II). For men, it used data from the Health Professionals Follow Up Study (HPFS). The Gu et al paper was an update of the Pan et al paper of 2011. The meat/T2D allegations have been ongoing for over a decade.
This Cambridge study was different. It didn’t use data from one or two population studies. It pooled the data from 31 population studies from 20 countries. It included the NHS I, NHS II and the HPFS, along with nine other studies from the Americas region. Nine studies were from Europe, two were from the Eastern Mediterranean region, seven were from the Western Pacific region and East Asia and there was one study from South Asia.
Of the 31 population studies used, 18 had not previously published anything on any association between meat consumption and T2D. The 31 studies were summarised in Table S1 of the supplementary appendix (Ref 7). Next to the rows for NHS I, NHS II and HPFS, the papers by Gu et al (2023) and Pan et al (2011) were cited.
This global approach was facilitated by a project called InterConnect, which is run by the Cambridge MRC epidemiology unit (Ref 8). InterConnect “optimises the use of existing data to enable new research into the causes of diabetes and obesity.” Think of InterConnect as a data gathering and analysing tool.
The ‘about InterConnect’ page noted that “The variation in the risk of diabetes and obesity between different countries and continents around the world is considerably greater than the variation in risk within individual countries.” That raised flags for me immediately. The Seven Countries study was the first epidemiological study to try to make claims about a nutrient (fat/saturated fat) across countries (Ref 9). Researchers who do this want you to believe that the nutrient of interest is the key factor – differences in climate, country GDP, education, health and political systems etc don’t need to be adjusted for.
I checked to see if the Li et al paper had taken the findings of previous work. This did not appear to be the case. (The abstract reported “Access to individual-participant data was provided by each cohort”, confirming that base data were used rather than previous findings.) For the combined two NHS studies and the HPFS, the Pan et al paper (2011) reported 13,759 cases of T2D. For the same 3 studies, the Gu et al paper (2023) reported 22,761 cases of T2D. That made sense, as one was an update of the other and more cases would have occurred since 2011. Table 1 of the Li et al paper reported 5,644 cases for NHS I, 7,411 for NHS II and 4,385 for the HPFS. That totals 17,440 cases. A more recent paper than Gu et al found over 5,000 fewer cases. Not even the incident rate can be agreed upon. Welcome to epidemiology.
That led me to check more numbers and I found more problems. Table 1 in the main paper reported the name of each study, the region it came from, the number of participants (reported as 1,966,444), the proportion of men/women, the average age of participants, the average meat consumption per day, and the number of cases of T2D (reported as 107,271) during the average number of years of follow-up (reported as 10). I entered participants, cases, years of follow-up (to calculate person years) and from that I could calculate incident rates per person year.
Nothing added up. The number of participants totalled 1,965,913 – instead of the 1,966,444 reported three times in the paper, including at the top of Table 1. The number of cases totalled 99,728 and not 107,271 as reported three times in the paper, including at the top of Table 1. There was another column for secondary cases (see definition below). This was supposed to add up to 112,110; it didn’t. I’ve emailed the corresponding author to query these discrepancies.
The highest incident rate per person year was 3.9% in the EPIC-InterAct study. This was the subject of a paper by Bendinelli et al in 2013 (Ref 10). The lowest incident rate came from a Chinese study (CHNS), which had a 0.04% incidence rate among nearly 8,000 people followed-up for 6 years.
Doing this exercise highlighted how vastly different the studies were in size. The Zutphen study had 485 participants and 11 cases of T2D in 4,850 person years. The CKB Chinese study had 482,423 participants and 9,601 cases in 3,473,446 person years. When studies this different are pooled, inevitably the small studies carry no weight.

Some definitions
Li et al decided to use two different definitions of T2D. These were called primary and secondary outcomes. These were defined in the paper and there seemed to be barely any difference between them (Ref 11). The secondary definition was described as “more inclusive” and the numbers of secondary definition cases were slightly higher where studies reported both numbers. Just over half (16 studies) had the same number of cases for primary and secondary definitions of T2D and the findings were reported on the primary definition numbers, so I wasn’t sure of the point of adding a secondary definition.
The paper didn’t define unprocessed meat and processed meat because it was relying on the original definitions of these in each of the 31 population studies. When we looked at Gu et al last October, the definition of meat was one of the major issues. Based on a 1980 Food Frequency Questionnaire (FFQ), processed red meats included beef or pork hot dogs; bacon; processed meat sandwiches; and other processed meats such as sausage. Unprocessed red meats included lean or extra lean hamburger; regular hamburger; beef, pork, or lamb as a sandwich or mixed dish (stew, casserole, lasagna etc); pork as a main dish; and beef or lamb as a main dish. The sandwich/lasagna (carbohydrate) confounder was therefore present in both processed and unprocessed red meat categories.
This error in definition of what we would call meat would likely have been made in many of the population studies rendering them useless. The Li et al paper has pooled up to 31 lots of useless definitions of meat to claim an association between ‘meat’ and T2D.
Serving sizes were defined as follows: “For unprocessed red meat and poultry, a serving was considered to be 100 g, whereas a serving of processed meat was considered to be 50 g. As commonly consumed, 100 g/day red meat equates to a daily consumption of a small steak or a medium-sized hamburger patty; 50 g/day processed meat equates to two or three slices of bacon or a medium-sized sausage.” i.e., a burger in a bun (with fries and milkshake), a bacon sandwich (with ketchup and a fizzy drink), etc.
The results
This was a classic meta-analysis paper. I used meta-analysis for my PhD, so I’m familiar with the technique (and pros and pitfalls thereof). Li et al took 31 population studies and pooled them together to see what the totality of the evidence showed. Figure 2 in the main paper was a beautiful summary of the outputs of meta-analysis. These are called forest plots. In Figure 2 (replicated below), we can see the risk ratio (HR) for each of the 31 studies for unprocessed red meat (100g/day), processed meat (50g/day) and poultry (100g/day). We can see the studies pooled together by region. We can see the weight given to each study and each region. We can see the overall risk ratios from pooling everything together.
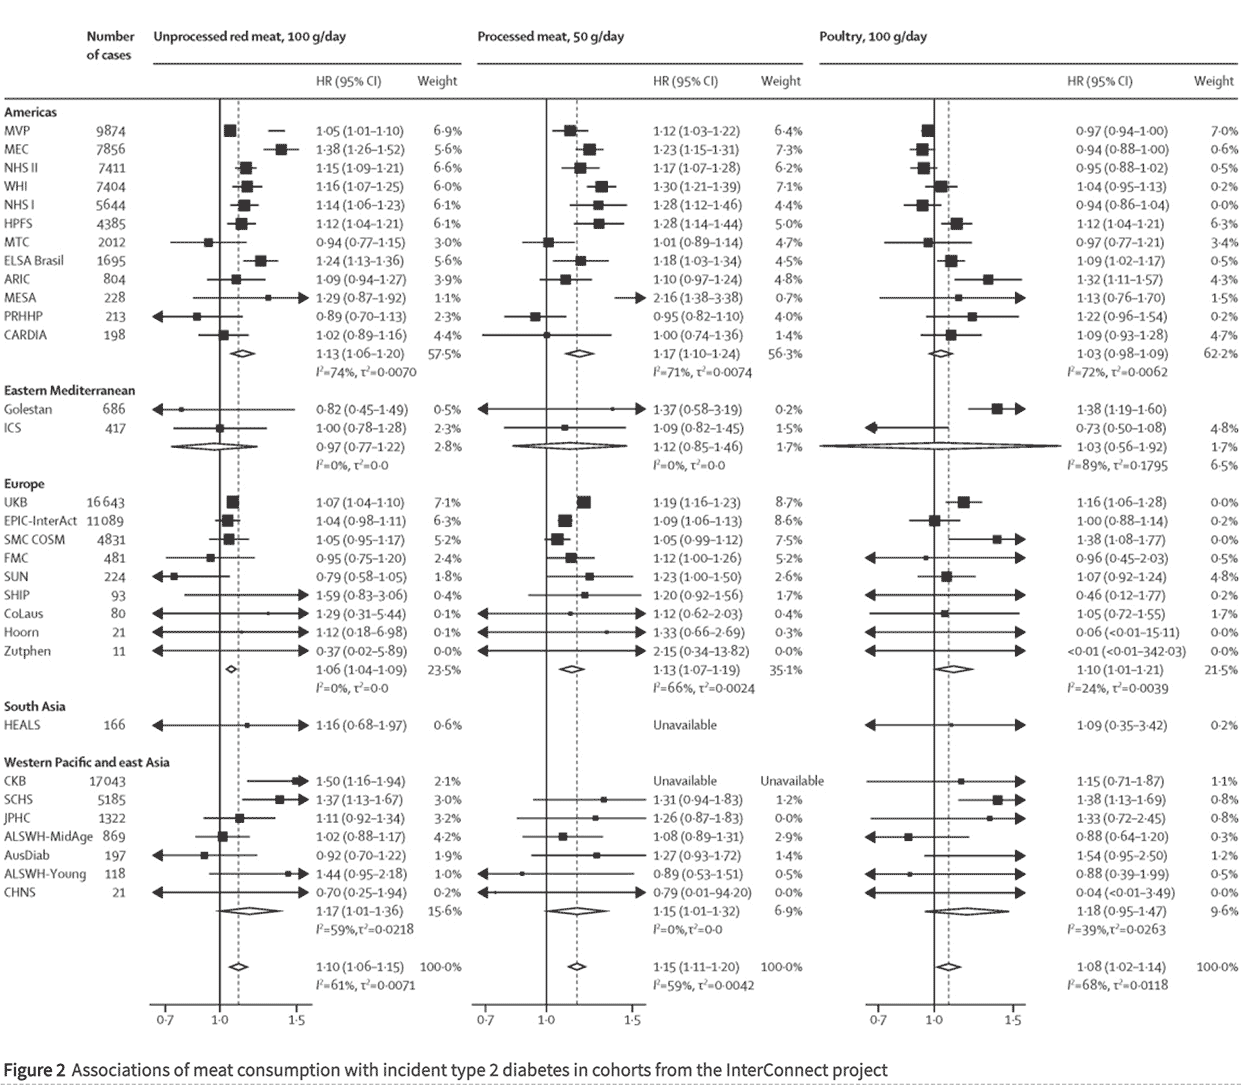
This was where the numbers in the abstract came from. There were three claims from pooling all data. (These are the numbers in the very bottom row in each column):
i) 100g/day of unprocessed red meat was associated with a 10% higher incidence of T2D (HR 1.10);
ii) 50g/day of processed meat was associated with a 15% higher incidence of T2D (HR 1.15);
iii) 100g/day of poultry was associated with an 8% higher incidence of T2D (HR 1.08) (Ref 12).
Those are tiny relative risks and nowhere near the bar to start considering causation. We’ll come back to that.
You can scan down the HR columns in Figure 2 to see at a glance which studies and which parts of the pooling together found nothing. Any confidence interval (that’s the range just after the HR) that includes 1.0 was not a significant result. At a glance, just looking at unprocessed red meat for starters, most individual studies found no association between unprocessed red meat and incidence of T2D. Five studies from the Americas found nothing. Neither Eastern Mediterranean study found anything. Only one European study found anything (UK Biobank) – the other eight found nothing. The one South Asian study found nothing. Five out of seven studies from the Western Pacific and East Asia region found nothing. That means that only 10 out of 31 studies found even an association between unprocessed red meat and T2D; that’s less than one third. That wasn’t the headline, was it?
The abstract of the paper reported “Positive associations between meat consumption and type 2 diabetes were observed in North America and in the European and Western Pacific regions; the CIs were wide in other regions.” The “Research in context” box-out reiterated this “the CIs were broader in the Eastern Mediterranean region and in south Asia.” Statisticians will either be laughing or rolling their eyes in horror at this point. If the confidence interval includes the number 1.0, there is no finding. It could have happened by chance. Instead of faithfully reporting that there were no findings for the Eastern Mediterranean region and South Asia, the researchers blamed the confidence intervals for being so wide/broad that they included the number 1.0. Naughty, naughty confidence intervals! At this point, I knew I was dealing with some disingenuity.
Nothing was found for poultry in the 12 studies from the Americas pooled together. Nothing was found for poultry in the Eastern Mediterranean pooled together, or Western Pacific and East Asia pooled together, or South Asia on its own. In fact only Europe pooled together found any association between poultry and incidence of T2D. Seven of the nine European studies found nothing individually.
Issues with this paper
We have the usual issues, which apply to any population study and which are amplified by pooling together many population studies:
Issue 1 – the inaccuracy of Food Frequency Questionnaires.
Of the 31 studies, 26 used food frequency questionnaires (FFQs), 3 used dietary history, and 2 used dietary records. All of these methods are unreliable. Also, as we saw in Gu et al, the FFQ was conducted in 1980 and yet claims are being made for how people eat in 2024.
Issue 2 – the definitions of meat included sandwiches and lasagna.
We literally are blaming the ham for what the bread did and the mince for what the pasta did.
Issue 3 – association not causation.
Population studies can only suggest associations, not causation. Notwithstanding all the issues with the original 31 studies and all the issues with the Li et al pooling together of those studies, even if this paper had been robust, it could still only claim associations. The Bradford Hill criteria advise that, unless associations are double, don’t bother looking for causation (Ref 13). None of the associations claimed in this paper are in that territory. The highest was 15% not the 100% needed to start exploring causation.
Issue 4 – relative vs absolute risk.
Another classic issue with all population studies is that they claim relative risk differences; absolute risk differences are usually tiny.
Notwithstanding that the numbers in Table 1 don’t add up, this paper reported that 107,271 cases of T2D were diagnosed among 1,966,444 adults followed up for an average of 10 years. That’s an event rate of 0.55% in any one year. Unprocessed red meat having a relative risk of 10% equates to the difference between a 0.57% or 0.52% risk rate in any one year of the study. Even if this were causal, and it isn’t, who cares?
Issue 5 – the healthy person confounder.
Every individual population study that I have looked at, with meat as the food of interest, has had a clear healthy person confounder. When you look at the characteristics table by meat intake, you can immediately see differences in people in the top and bottom groups. The red meat intake is never the only difference. The highest red meat consumers have higher BMIs, they are less physically active, they are more likely to be current smokers and they are less likely to take multivitamins etc. There is always a healthy person confounder. The burger/hot dog consumer is less healthy than the quinoa/kumquat consumer in many ways – not just red meat.
Population studies want you to believe that if only the burger eating, obese, sedentary, smoker ditched the meat in the burger, they would be as healthy as the quinoa/kumquat consumer. That’s the essence of epidemiology, which is why it should be banned.
We now turn to the issues specific to this study:
Issue 6 – the studies are too different to be pooled together.
There’s an important number in meta-analysis, which people unfamiliar with this technique would not be aware of. It’s called I2. I2 is a measure of heterogeneity. It tells us how different the studies are that were pooled together. The more different they are, the less robust results are from pooing them together.
For example, if I pool together studies on Asian people who eat pork with wok-fry vegetables and Americans who eat burgers and fries, I2 will be high because the studies are so different (and thus incomparable). That’s exactly what this Li et al study has done. The I2 figures ranged from 59% to 68% for the 3 main claims. Those numbers are telling us that the studies were too different to be pooled together so take any results with caution.
Issue 7 – meat consumption was barely half the large intake used to estimate risk.
The study presented risks per 100g/day of unprocessed meat, per 50g/day of processed meat and per 100g/day of poultry. Supplementary Appendix Figure S1 contained a coloured diagram trying to illustrate average (median) meat consumption across all 31 studies.
This showed that average intake of unprocessed red meat ranged between 0 and 110g/day. Most studies averaged below 50g/day. Only one study reported average unprocessed red meat consumption above 100g/day. (This was CARDIA – which found no significant results by the way). Average intake of processed meat ranged between 0 and 49g/day. Most studies averaged barely 10-15g/day. Average intake of poultry ranged between 0 and 72g/day. Visually, intake looked to average around 25-30g/day.
Hence the Lancet paper estimated the risk of consuming more meat than virtually every individual study reported as its average intake. This is like saying, across 31 studies, people averaged fewer than 50 cigarettes a week, but we’re going to estimate the risk of smoking 100 cigarettes a week.
Issue 8 – plausible mechanism.
The discussion section of a population paper needs to offer a plausible explanation for the association claimed. This one admitted “The underlying mechanisms that link meat intake with the development of type 2 diabetes are not fully established.” It then admitted that randomised controlled trials have investigated a mechanist link between meat and risk markers for T2D (like HbA1c and insulin resistance) “however, no definitive effects have been reported.”
In the absence of trial evidence for possible mechanisms, the researchers suggested a few hypotheses:
– “Red meat is rich in saturated fatty acids but low in polyunsaturated fatty acids, and switching from a diet rich in saturated fatty acids to one rich in polyunsaturated fatty acids was found to be associated with improved insulin resistance in a meta-analysis of short-term trials” (Ref 14).
This fails because red meat is not rich in saturated fatty acids. Meat is mostly water. Protein is usually the next major part. Of the remaining part that is fat, there is more unsaturated than saturated fat. The main fat in meat is invariably monounsaturated fat. Dairy products are the only food group with more saturated than unsaturated fat. If saturated fat is the proposed mechanism, then you needed to study dairy products (Ref 15).
– “Meat is characterised by its high protein content, and some research has indicated a potential association between a high intake of animal proteins and increased risk of type 2 diabetes.”
This fails because poultry tends to be higher in protein than red or processed meat and virtually no associations were found for poultry.
– “Another potential mechanism could be via TMAO, which is abundant in red meat.”
This fails because fish is the richest source of (preformed) TMAO and fish is not claimed to be a risk factor for death or avoidable disease – usually on the contrary (Ref 16).
– “Meat can be a major source of iron in many populations, but long-term iron intake has been implicated in an increased risk of type 2 diabetes.”
This fails because sardines have more iron than steak and cocoa powder more still (although less absorbable). Where is the attack on oily fish and T2D? Plus chicken is not far behind steak for iron, and chicken liver far higher than steak, and poultry found virtually nothing. Finally, many people are at risk of iron deficiency and heme iron is the optimally absorbable form, so let’s worry about too much once we get enough (Ref 17).
This brings us to the wealth of nutrition generally in red meat, which would be lost if Li et al succeeded in their aim to reduce meat intake (which, make no mistake, is what this paper intends).
I’ll tell you my plausible mechanism. Meat is eaten with carbs – burgers and hot dogs come in buns and are consumed with fries and fizzy drinks. Ham comes in sandwiches, with crisps and fizzy drink ‘meal deal’. Mince comes with lasagne. Steak with chips and so on. Unless you’re a carnivore or keto diet follower, meat is eaten with carbs.
This brings us full circle back to my first thought and tweet. Don’t blame the ham for what the bread did. Epidemiology is being abused by people with an agenda. This won’t stop; so we need to dissect and dismiss the relentless non-sense.

References
Ref 1: https://www.thetimes.com/article/9ef4c5a8-cc5d-498e-8713-5395a3f69a4f?shareToken
Ref 2: https://www.cam.ac.uk/research/news/red-and-processed-meat-consumption-associated-with-higher-type-2-diabetes-risk#
Ref 3: Li et al. Meat consumption and incident type 2 diabetes: an individual-participant federated meta-analysis of 1·97 million adults with 100 000 incident cases from 31 cohorts in 20 countries. Lancet. August 2024. https://www.thelancet.com/journals/landia/article/PIIS2213-8587(24)00179-7/fulltext
Ref 4: Sugars/starches can often be found in processed meat (hams, sausages, burgers etc) but again – don’t blame the meat for what the sugars/starches did.
Ref 5: Gu et al. Red meat intake and risk of type 2 diabetes in a prospective cohort study of United States females and males. AJCN. October 2023. https://ajcn.nutrition.org/article/S0002-9165(23)66119-2/fulltext
Ref 6: https://www.zoeharcombe.com/2023/10/red-meat-type-2-diabetes/
Ref 7: https://www.thelancet.com/journals/landia/article/PIIS2213-8587(24)00179-7/fulltext#supplementaryMaterial
Ref 8: https://www.mrc-epid.cam.ac.uk/interconnect/
Ref 9: Keys et al. Coronary heart disease in seven countries I. The study program and objectives. Circulation. 1970.
Ref 10: InterAct Consortium Bendinelli et al. Association between dietary meat consumption and incident type 2 diabetes: the EPIC-InterAct study. Diabetologia. 2013. https://pubmed.ncbi.nlm.nih.gov/22983636/
Ref 11: “For the primary definition, a case of incident type 2 diabetes was confirmed if one or more of the following criteria were fulfilled: (1) diagnosis ascertained by linkage to a registry or medical record; (2) confirmed use of antidiabetic medication; or (3) self-report of diagnosis by physician or use of antidiabetic medication, verified by any of the following: at least one additional source from (1) and (2); biochemical measurement (glucose concentration or HbA1c); or a validation study in which subjective information was verified by a within-cohort validation substudy with high concordance. For the secondary definition, which was more inclusive, a case of incident type 2 diabetes was confirmed if any of the following criteria were fulfilled: diagnosis ascertained by linkage to a registry or medical record; confirmed use of antidiabetic medication; self-report of diagnosis by physician or use of antidiabetic medication; or biochemical measurement (glucose concentration or HbA1c).”
Ref 12: “Greater consumption of each of the three types of meat was associated with increased incidence of type 2 diabetes, with HRs of 1·10 (95% CI 1·06–1·15) per 100 g/day of unprocessed red meat (I²=61%), 1·15 (1·11–1·20) per 50 g/day of processed meat (I²=59%), and 1·08 (1·02–1·14) per 100 g/day of poultry (I²=68%).”
Ref 13: https://www.zoeharcombe.com/2016/09/the-bradford-hill-criteria/
Ref 14: Their ref 43, which was Imamura et al. Effects of saturated fat, polyunsaturated fat, monounsaturated fat, and carbohydrate on glucose–insulin homeostasis: a systematic review and meta-analysis of randomised controlled feeding trials. PLoS Med. 2016.
Ref 15: https://www.zoeharcombe.com/2022/04/meat-saturated-fat/
Ref 16: https://www.zoeharcombe.com/2020/08/meat-plants-tmao/
Ref 17: https://www.zoeharcombe.com/2018/10/heme-iron/


