Saturated fat & CHD in Europe
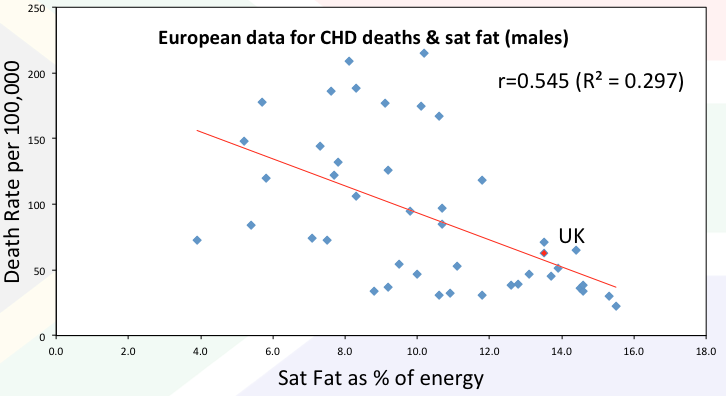
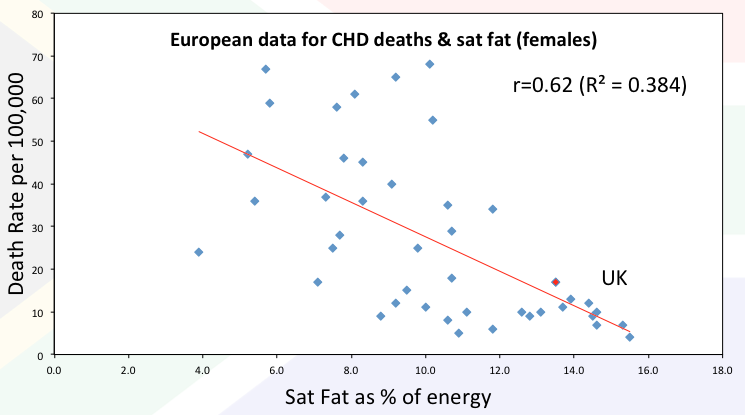
This post shows that, for all 192 countries in the world, for men and women, for CVD deaths and all-cause mortality, the HIGHER the cholesterol levels, the LOWER the death rate; the LOWER the cholesterol levels, the HIGHER the death rate. The Pearson correlation coefficient gets higher as we move from male CVD deaths to female CVD deaths to male all deaths to female all deaths. This blog repeats the exercise of examining the association between heart disease (this time CHD) and an accused causal agent (this time saturated fat). The data is available for Europe here [Ref 1]. As you can see below, the association is again inverse – the higher the saturated fat intake, the lower the CHD death rate for males… and females… The

This post shows that, for all 192 countries in the world, for men and women, for CVD deaths and all-cause mortality, the HIGHER the cholesterol levels, the LOWER the death rate; the LOWER the cholesterol levels, the HIGHER the death rate. The Pearson correlation coefficient gets higher as we move from male CVD deaths to female CVD deaths to male all deaths to female all deaths.
This blog repeats the exercise of examining the association between heart disease (this time CHD) and an accused causal agent (this time saturated fat). The data is available for Europe here [Ref 1]. As you can see below, the association is again inverse – the higher the saturated fat intake, the lower the CHD death rate for males…

and females…

The correlation for males (r) is 0.545 and it is even stronger (0.62) for females.
The top and bottom seven
In the brilliant “The Great Cholesterol Con”, Dr Malcolm Kendrick reviewed the top and bottom seven countries for saturated fat intake in Europe and the countries with the highest and lowest levels of heart deaths. He used the MONICA data from c. 1998. I repeated this for the 2008 data [Ref 1].
* The 7 countries with the LOWEST saturated fat intake were Bosnia & Herzegovinia; Georgia; Azerbaijan; Tajikstan; Moldova; Croatia; Armenia.
Their saturated fat intake ranged from 3.9-7.3{c754d8f4a6af077a182a96e5a5e47e38ce50ff83c235579d09299c097124e52d}. The average was 5.8{c754d8f4a6af077a182a96e5a5e47e38ce50ff83c235579d09299c097124e52d} – all way below the recommended 10{c754d8f4a6af077a182a96e5a5e47e38ce50ff83c235579d09299c097124e52d} saturated fat limit set by dietary guidelines.
* The 7 countries with the HIGHEST saturated fat intake were Austria; Finland; Belgium; Iceland; Netherlands; Switzerland; France (France is the single country with the highest saturated fat intake in Europe and the lowest rate of CHD deaths).
Their saturated fat intake ranged from 13.9-15.5{c754d8f4a6af077a182a96e5a5e47e38ce50ff83c235579d09299c097124e52d}. The average was 14.7{c754d8f4a6af077a182a96e5a5e47e38ce50ff83c235579d09299c097124e52d} – all way above the recommended 10{c754d8f4a6af077a182a96e5a5e47e38ce50ff83c235579d09299c097124e52d} saturated fat limit set by dietary guidelines.
* The 7 countries with the LOWEST saturated fat intake had the following death rates:
– Male deaths per 100,000 ranged from 73-178, with an average death rate of 117.
– Female deaths per 100,000 ranged from 17-67, with an average death rate of 41.
* The 7 countries with the HIGHEST saturated fat intake had the following death rates:
– Male deaths per 100,000 ranged from 22-65, with an average death rate of 39.
– Female deaths per 100,000 ranged from 4-13, with an average death rate of 9.
Death rates for men were 3 times higher in the lowest saturated fat intake countries than the highest.
Death rates for women were 4.5 times higher in the lowest saturated fat intake countries than the highest.
As Malcolm found from the 1998 data – every single country in the top 7 saturated fat intake countries had a lower death rate than every single country in the bottom 7 saturated fat intake countries. This held for men and women. It holds again with the data from 10 years on.
The nutrition
Two facts are not widely enough known about fat/saturated fat and this explains much of the nonsense claimed about saturated fat. If people knew what saturated fat actually is, they would find their allegations about this life-vital nutrient as absurd as they are:
1) All food that contains fat contains all three natural fats (saturated, monounsaturated and polyunsaturated). There are no exceptions.
Meat, fish, eggs, dairy, nuts, seeds, olives, avocados – all of these foods contain all three fats. It is completely impossible to eat unsaturated fat without saturated fat, or vice versa.
2) The only food group that contains more saturated than unsaturated fat is dairy products. Meat has more unsaturated than saturated fat; eggs have more unsaturated than saturated fat; LARD has more unsaturated than saturated fat – not that any real fat is better or worse than any other – but just to set the record straight.
So – if you want a row about saturated fat – you’re having a row about dairy products and you may want to bear this in mind: There is evidence of a re-emergence of rickets and osteoporosis is rising [Ref 2]. The Family Food survey has reported that the present UK diet is deficient in retinol and vitamin D, providing less than one third of the UK Reference Nutrient Intake and barely a fifth of the recently revised American RDA for vitamin D [Ref 3].
As our 2013 paper suggests: “Using a 100 g steak, as an example, with 5.4 g of fat, it is difficult to accept that the 39{c754d8f4a6af077a182a96e5a5e47e38ce50ff83c235579d09299c097124e52d} of the fat which is saturated is damaging to the cardiovascular system while the 61{c754d8f4a6af077a182a96e5a5e47e38ce50ff83c235579d09299c097124e52d} of the fat which is unsaturated is protective. Keeping in mind that the total fat content of the steak will provide all but 3 of the 13 vitamins and 16 minerals that are a pre-requisite for the maintenance of good health.”
[Ref 1] Allender S, Scarborough P, Peto V, Rayner M. European Cardiovascular Disease Statistics: British Heart Foundation Health Promotion Research Group, 2008.
[Ref 2] S. H. Pearce and T. D. Cheetham, “Diagnosis and Management of Vitamin D Deficiency,” BMJ, Vol. 340, 2010, p. b5664. doi:10.1136/bmj.b5664
[Ref 3] DEFRA (The Department for Environment, Food and Rural Affairs), “A National Statistics Publication, the Family Food Survey,” The Department for Environment, Food and Rural Affairs, London, 2010.
SOURCE: Zoë Harcombe – Read entire story here.


